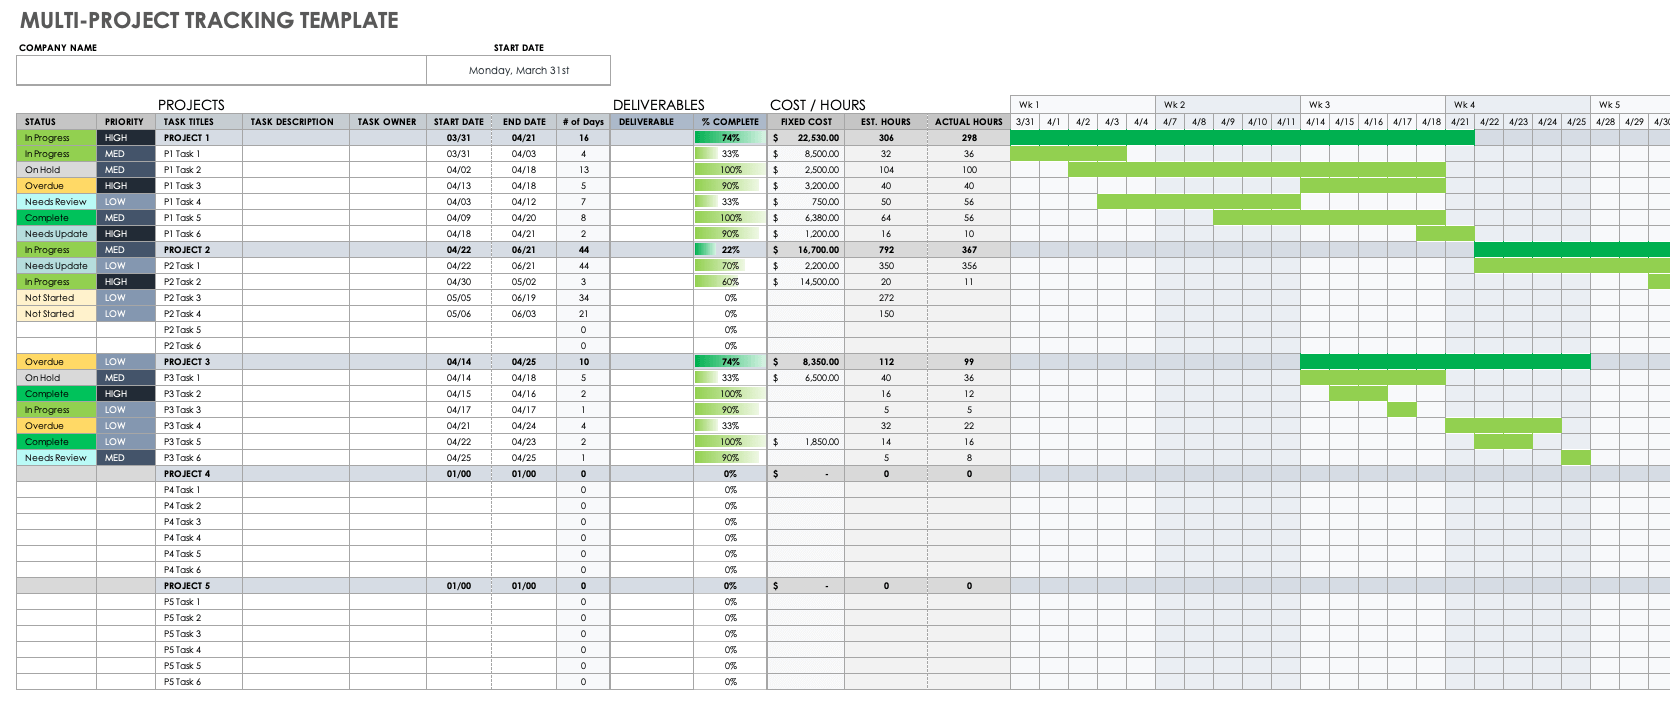
Multi-Project Tracking Template
Use this template to stay organized while tracking multiple projects. The spreadsheet includes project details, such as task descriptions and owners, deliverables, costs, and hours. You can also set a priority for each task and monitor the progress of your program by updating the status and percent complete columns for all activities. This Gantt chart shows project schedules based on the starting and ending dates that you select.
Download Multi-Project Tracking Template
Transform your project details into an easy-to-read Gantt chart with Smartsheet
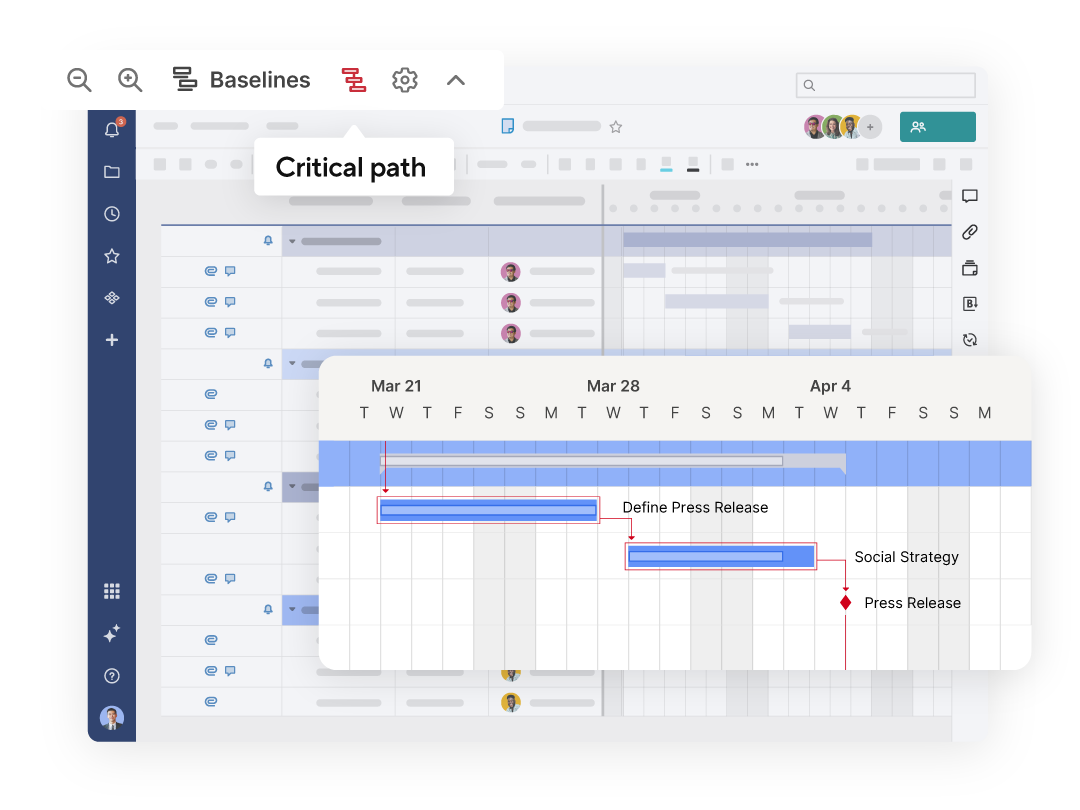
Smartsheet Gantt charts are a powerful tool for project planning, scheduling, and progress tracking. Display tasks across time with horizontal bars, view dependencies between tasks with ease, highlight important milestones, and identify a project's critical path to prioritize essential tasks.
Explore the full range of robust features when you try Smartsheet free for 30 days.
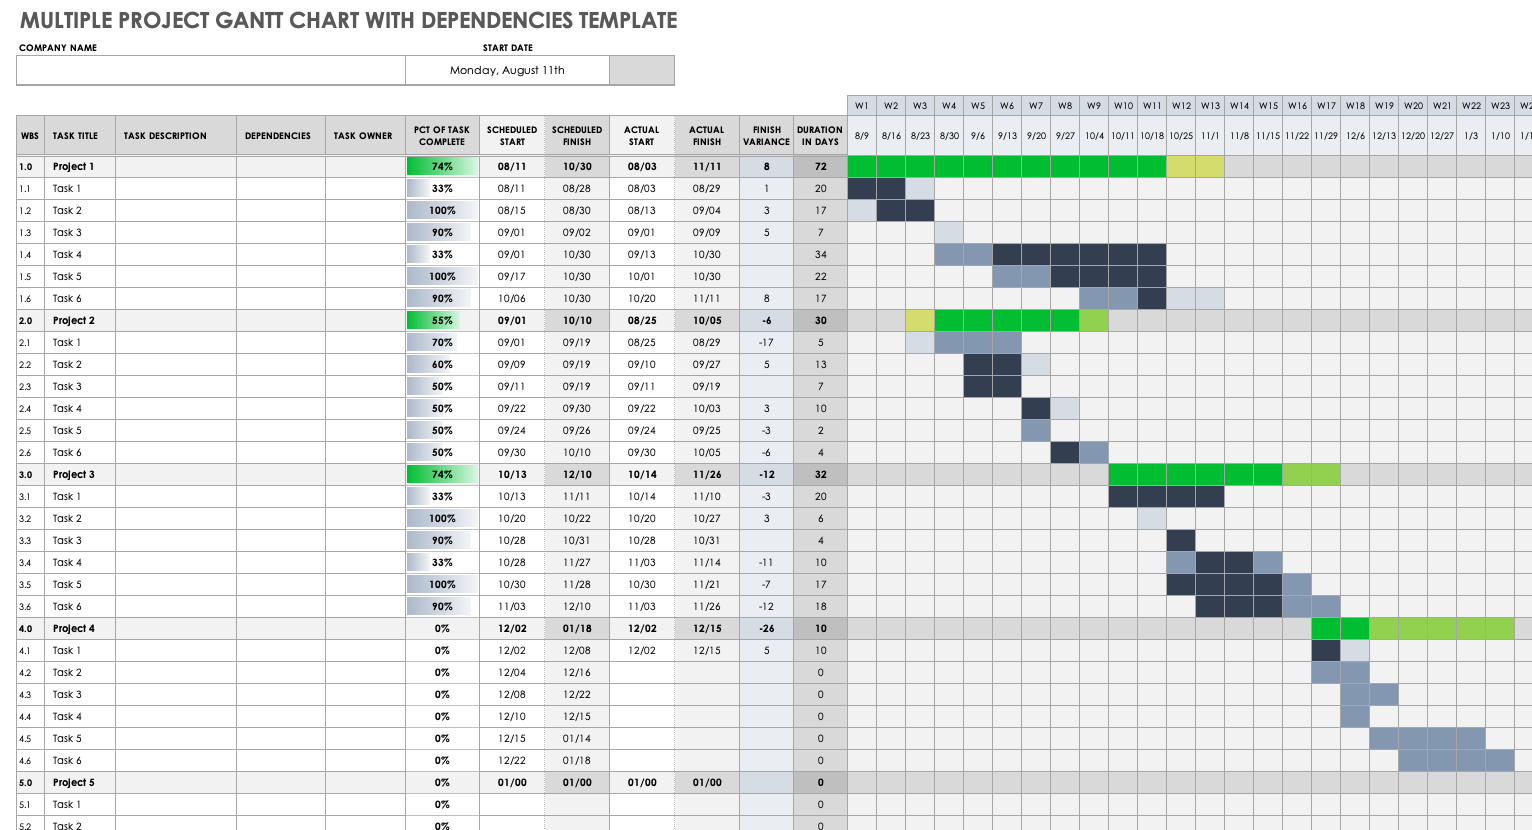
Multiple Project Gantt Chart with Dependencies
To use this template, simply enter your project data, and the template will automatically generate a Gantt chart that shows the duration of each task. This template allows you to track owners, dependencies, and percentage complete for each task, and also includes a work breakdown structure for each project. The first tab in the template includes example data for a sample Gantt chart; the second tab is blank for you to input your project information.
Download Multiple Project Gantt Chart with Dependencies
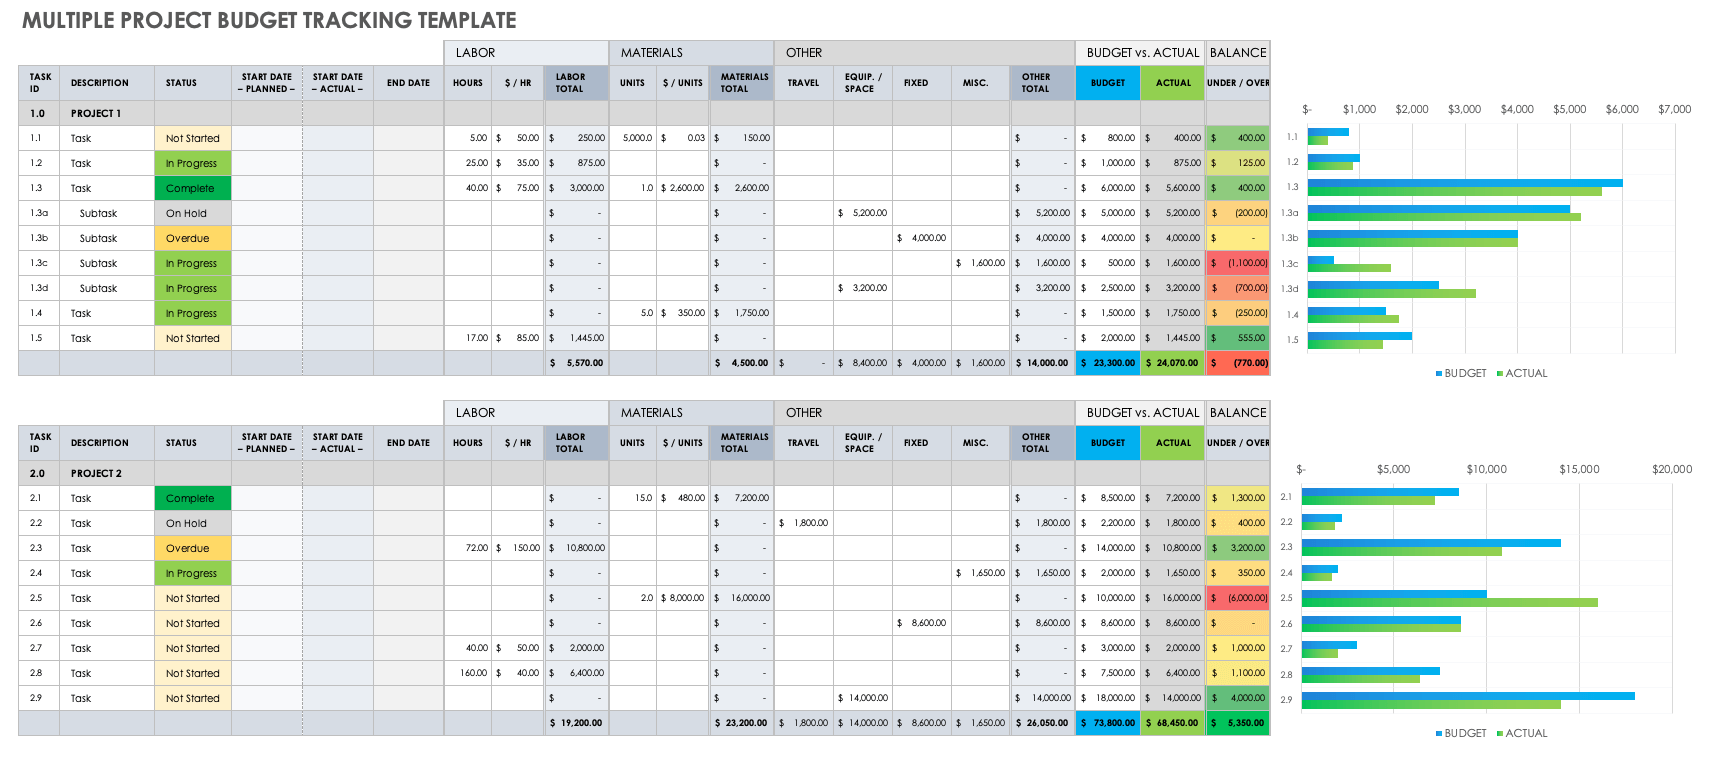
Multiple Project Budget Gantt Chart Template
This customizable template is designed for managing budgets on multiple projects. You’ll find a detailed spreadsheet that shows the start and end date for each task, current task status, and itemized expenses for each project. Estimated and actual costs also appear on the Gantt chart.
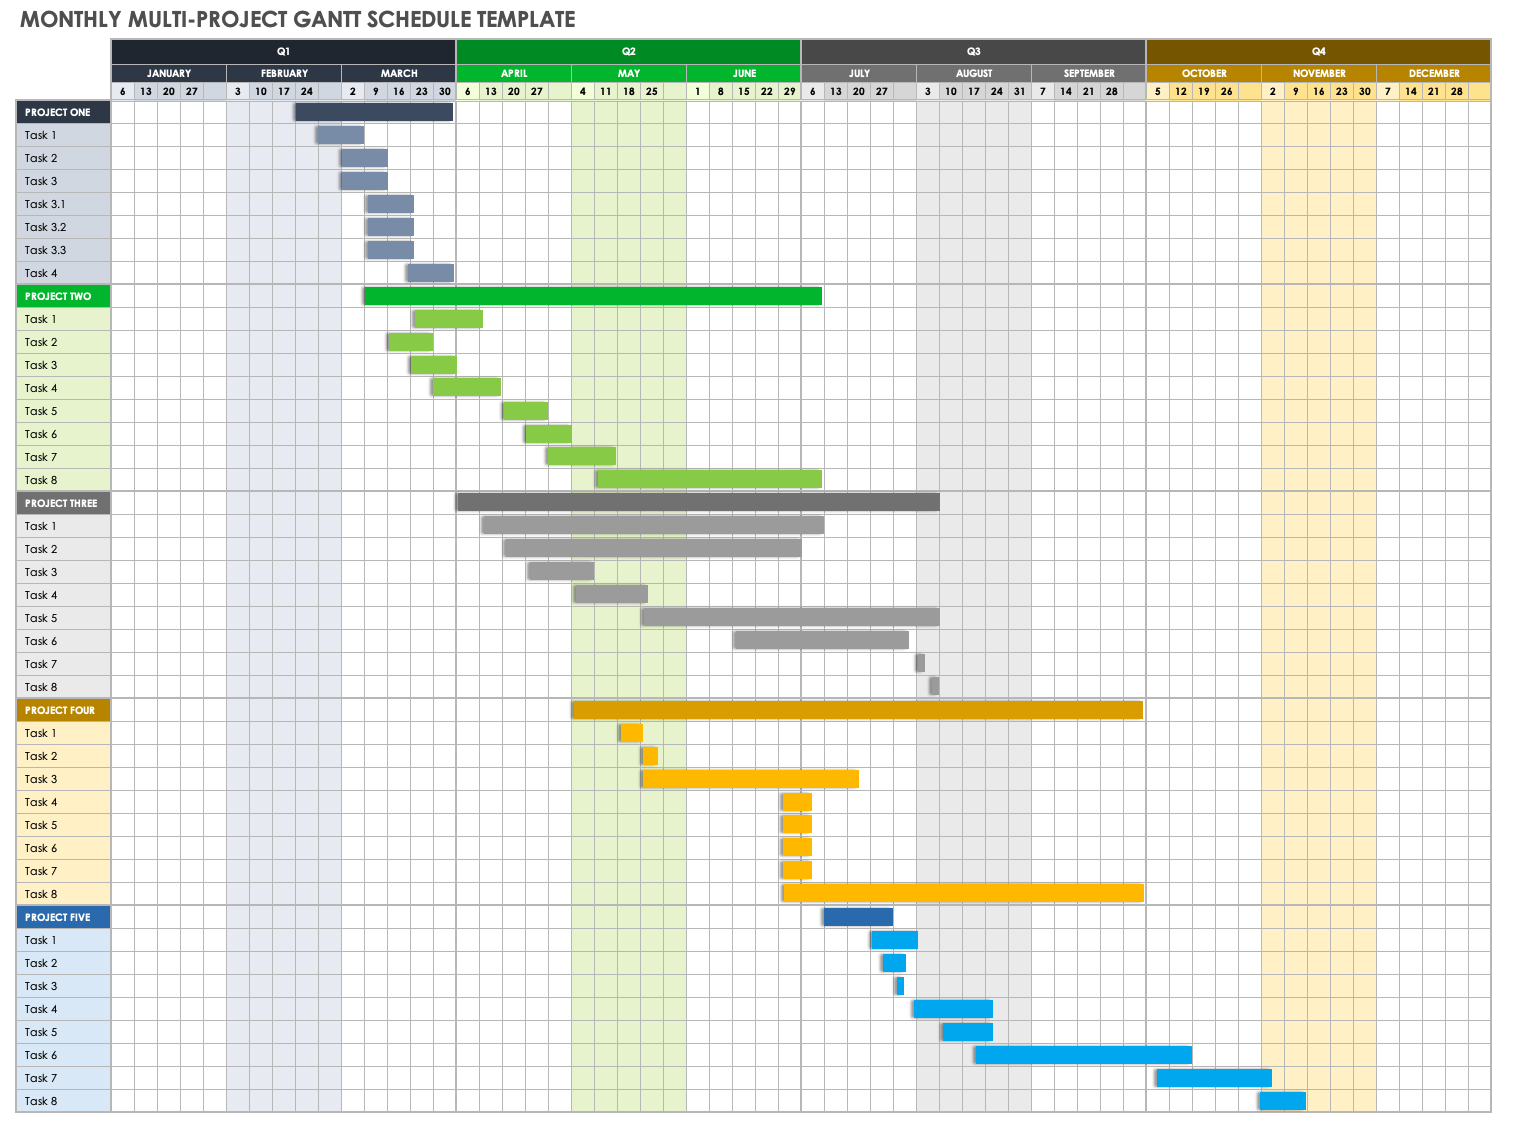
Monthly Multi-Project Gantt Schedule Template
Plan and track monthly schedules with this simple Gantt chart for multiple projects. The chart uses different colors to distinguish between projects, which makes it easy to get a snapshot of task timelines. Enter the required activities for each project and add corresponding bars to the Gantt chart. This template is useful for viewing a breakdown of tasks, along with an overview of multiple project schedules.
Download Monthly Multi-Project Gantt Schedule Template
Multiple Project Dashboard Template
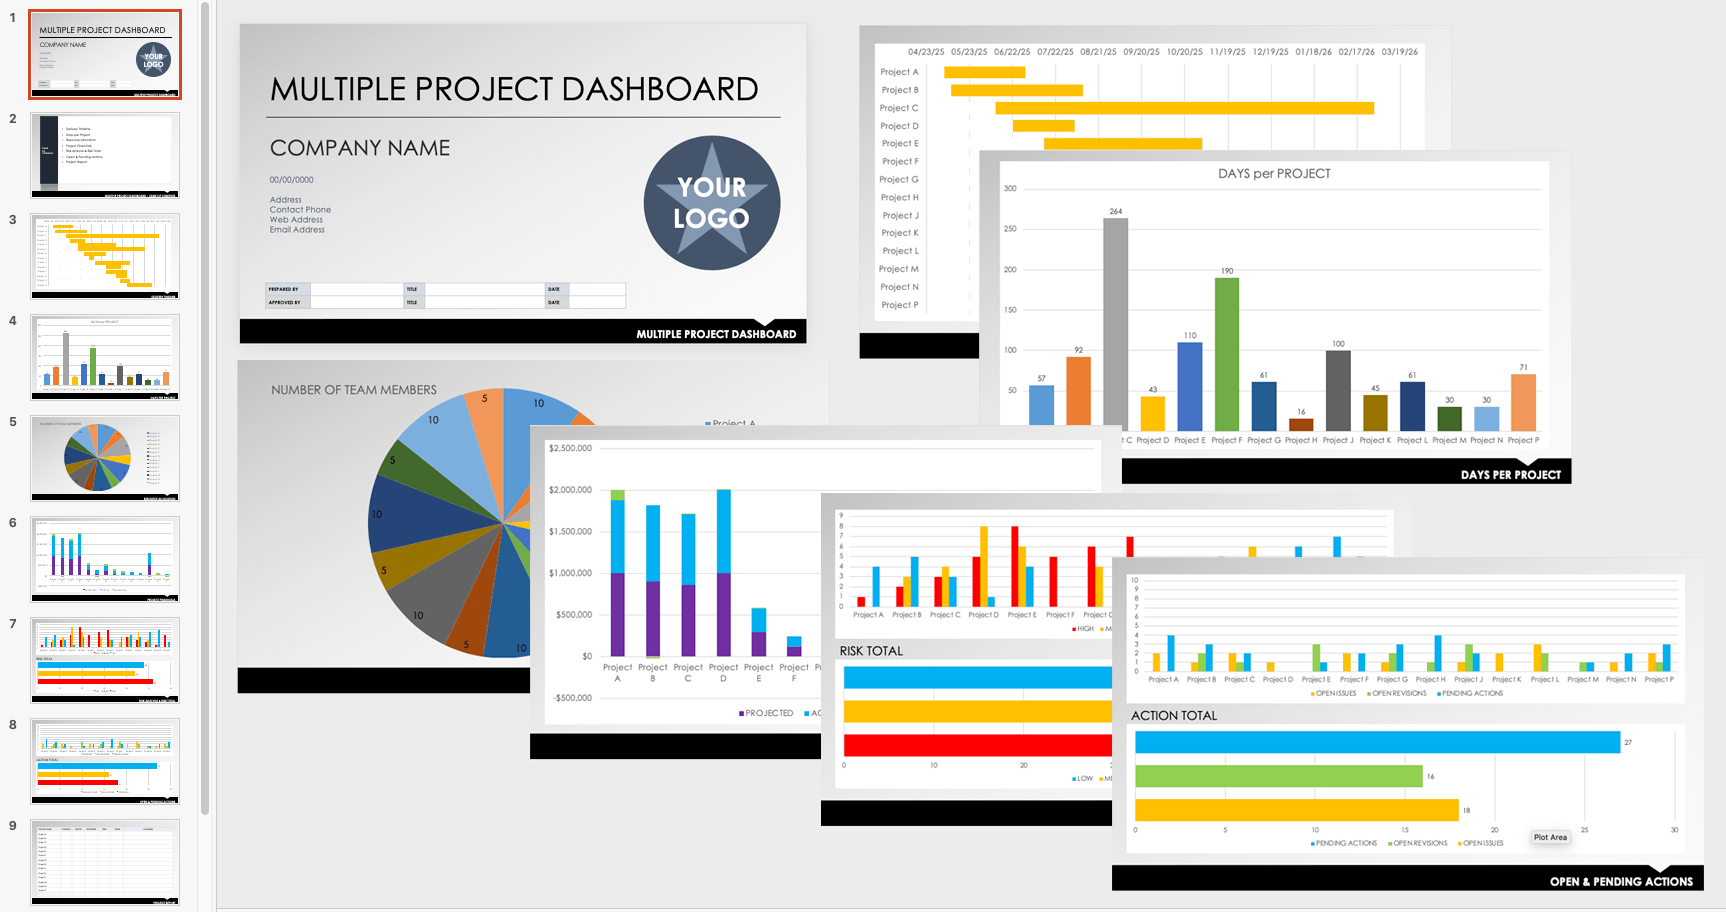
This dashboard template provides a visual representation of data to help you manage multiple projects simultaneously. Use the Gantt chart to track multiple projects and view each project on a timeline. Stay on top of your projects by viewing the bar charts for financials, risk analysis, and open issues. Ultimately, this template will provide you with a quick overview of important data for several projects at a glance.
Download Multiple Project Dashboard Template
Using a Gantt Chart to Track Multiple Projects
There are many potential challenges when managing multiple projects: tracking risks to avoid major issues, allocating resources, and juggling management tasks without causing delays. A Gantt chart offers visual tracking, making it easier to see project dependencies, milestones, and progress.
Using a Gantt chart template is a simple and flexible way to organize project information. To learn more, get tips on how to customize and best utilize an Excel Gantt chart template.
Comprehensive Guide to Gantt Charts
Visit our “Gantt Chart Guide” to learn more about the benefits and challenges of using this essential project management tool, how to choose the right Gantt chart software, and other relevant topics. For instructions on creating your own template, see the tutorial, “How to Create a Simple Gantt Chart in Any Version of Excel.”
Make Better Decisions, Faster with Gantt Charts in Smartsheet
From simple task management and project planning to complex resource and portfolio management, Smartsheet helps you improve collaboration and increase work velocity -- empowering you to get more done.
The Smartsheet platform makes it easy to plan, capture, manage, and report on work from anywhere, helping your team be more effective and get more done. Report on key metrics and get real-time visibility into work as it happens with roll-up reports, dashboards, and automated workflows built to keep your team connected and informed.
When teams have clarity into the work getting done, there’s no telling how much more they can accomplish in the same amount of time. Try Smartsheet for free, today.
