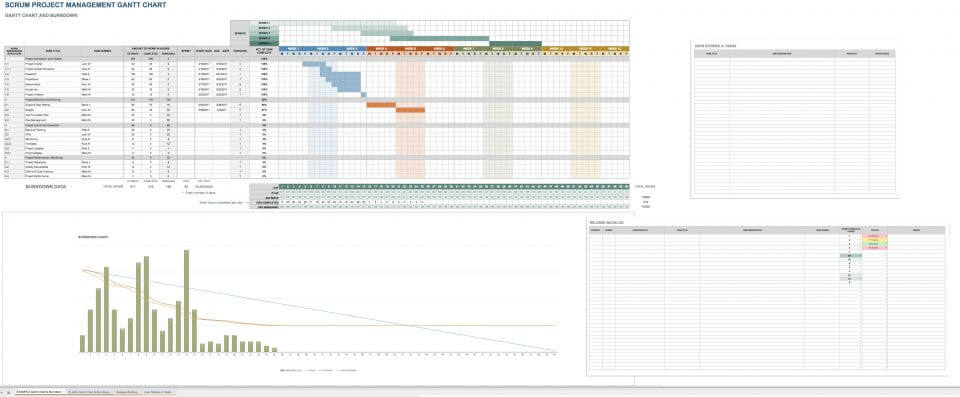
Advanced Project Gantt Chart Template
Use this Gantt chart Google Sheets template to manage a complex project, or to manage multiple projects simultaneously. It allows you to track phases, milestones, tasks, and subtasks, as well as the percentage of work completed for each. Plot task dependencies so you can see how delays will impact the schedule and milestone achievement. You can also track how closely your project is adhering to the schedule established during project planning. Finally, if you are basing your Gantt chart off of a work breakdown structure, there is a column to enter the WBS number corresponding to the task.
Transform your project details into an easy-to-read Gantt chart with Smartsheet
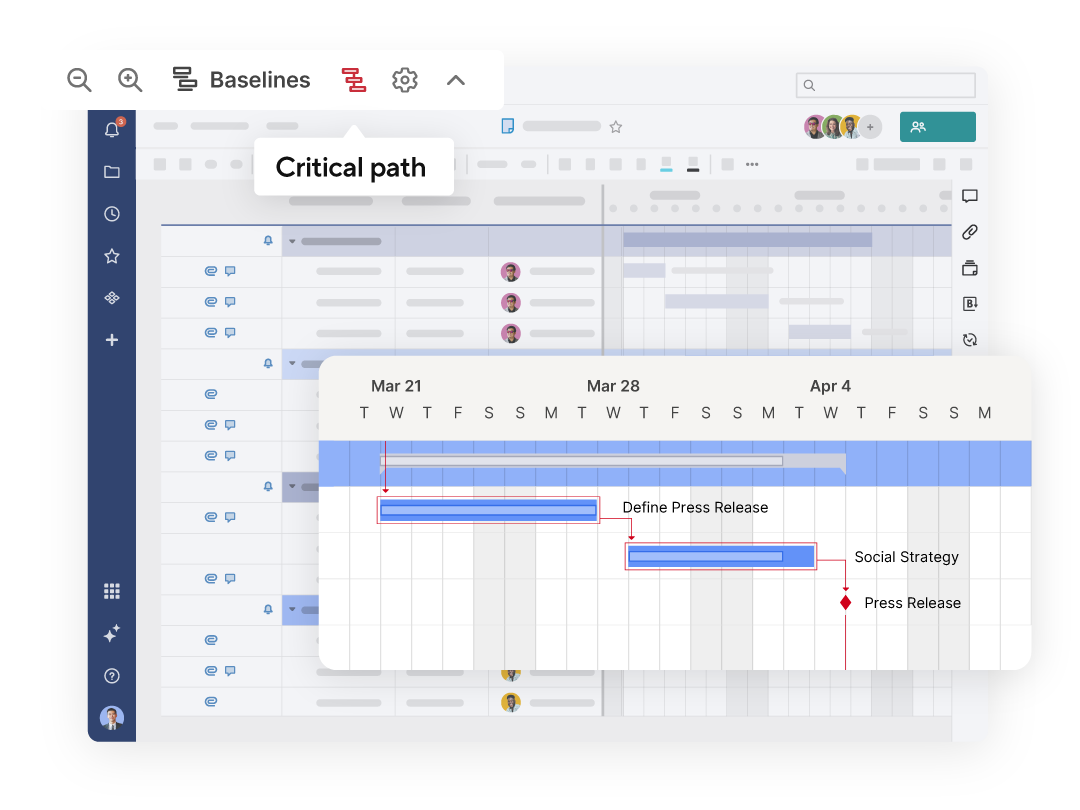
Smartsheet Gantt charts are a powerful tool for project planning, scheduling, and progress tracking. Display tasks across time with horizontal bars, view dependencies between tasks with ease, highlight important milestones, and identify a project's critical path to prioritize essential tasks.
Explore the full range of robust features when you try Smartsheet free for 30 days.
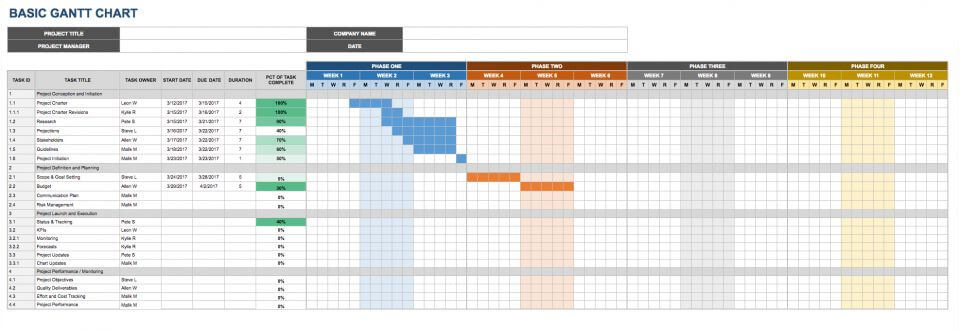
Basic Gantt Chart Template
Have a simple project to track, or just need to get started quickly? This basic Google spreadsheet Gantt chart template will help you schedule your project in no time. Simply plug in your task data, the start and end date(s), the task duration, and the team member responsible for each, and the template will visualize each task on the timeline.
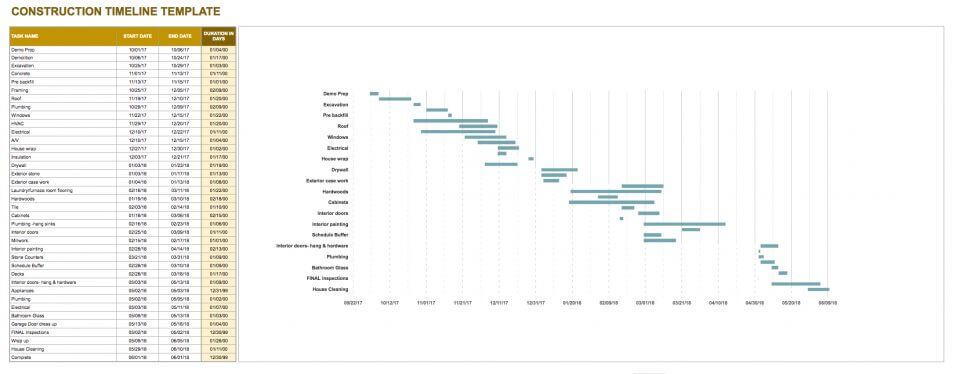
Construction Gantt Chart Template
In construction projects, it’s imperative that all tasks are carefully planned and monitored. If even one key task is overlooked, the project’s completion can be delayed — not to mention, there could be serious safety implications. This Google Sheets Gantt chart template for construction projects offers one sheet where you can enter all tasks, their start and end dates, and their durations on a timeline. The next sheet automatically displays these tasks in Gantt chart form, so you can clearly track how the project is progressing and gauge the impact of any delays on completion.
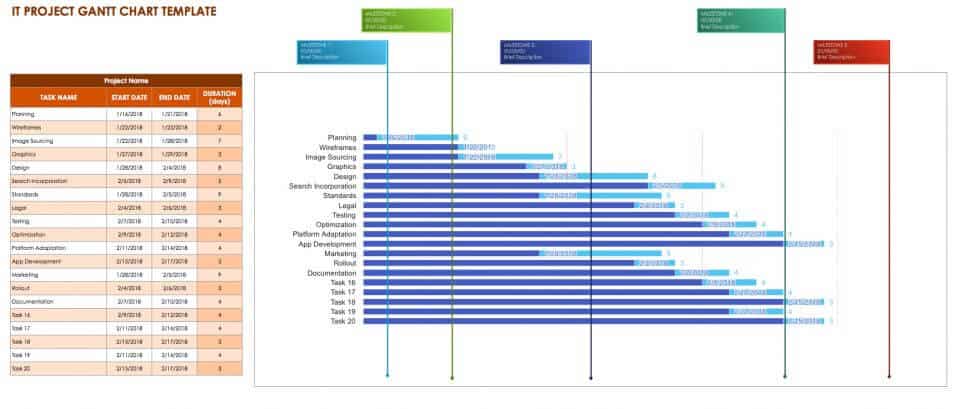
IT Project Gantt Chart Template
IT projects have particularly serious implications for an organization, if not managed correctly. Using a Gantt chart template for Google Sheets can help IT project managers ensure tasks are scheduled and appropriate team members are assigned, in order to complete essential deliverables and reach milestones on time. You can use this template for a variety of IT projects, including software product development, feature releases, hardware or software upgrades and installations, and system or network migrations.
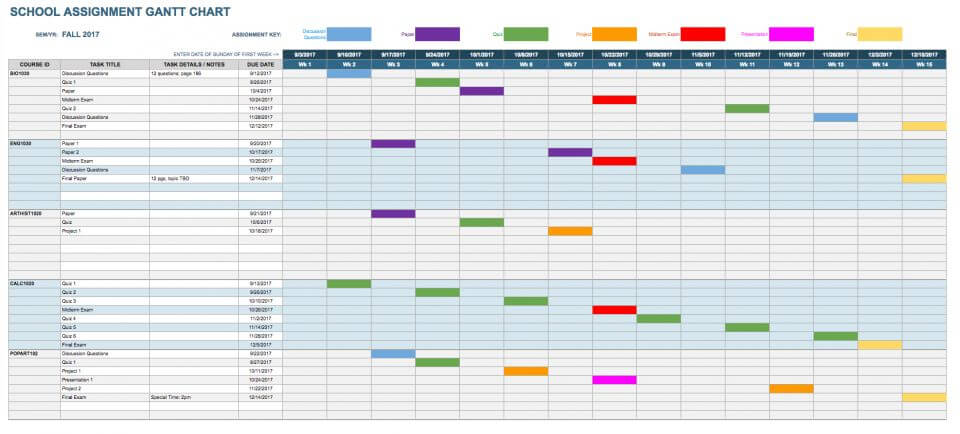
School Assignment Gantt Chart Template
Gantt charts aren’t just for business purposes — you can also use them to keep track of academic assignments. This Google Gantt chart template helps students keep track of papers, tests, and deadlines, or break up large school projects into manageable chunks. Juggling coursework can be overwhelming, so use this template to plan when to work on assignments for each course and minimize overlap. This will help you get important papers, projects, and studying done on time.
What Is a Gantt Chart?
Gantt charts are a tool used to track the completion of work over time. They allow you to visualize the amount of work remaining in tasks, phases, and the project as a whole. Gantt charts are frequently utilized in project management to track project, task, and team schedules. They may also be used for other purposes, such as tracking school assignments or visualizing software development projects.
Depicted as a horizontal bar chart, a Gantt chart tracks:
- Project progress
- Completion of tasks and activities
- Amount of work remaining in the entire project or release
- Percentage of work completed for individual tasks
- Which work phase each task falls under
- Task dependencies (tasks that must be completed before others can begin)
- The team member(s) responsible for completing different tasks
- Task duration (the estimated amount of time to complete a task)
- Which tasks can be worked on simultaneously
The horizontal axis of a Gantt chart typically shows the project schedule broken into smaller intervals of time (hours, days, weeks, or months). The vertical axis lists the tasks required to complete the project, and may also show task hierarchy (the larger phases of each task as well as subtasks). Some charts also allow you to track task dependencies, the work breakdown structure (WBS), and key milestones.
You may use colors, shading, symbols, or other notations to indicate the percentage of work completed in a task or project, milestones, dependencies, and past-due tasks. Ultimately, a Gantt chart offers managers, team members, and stakeholders an at-a-glance view of progress.
Benefits of Using Gantt Charts
There are many good reasons to use a Gantt chart to visualize work and projects. Gantt charts:
- Provide an at-a-glance view of project schedules, so team members and managers can stay on track.
- Facilitate project management and collaboration.
- Allow managers to identify past-due tasks and project delays, so they can take proactive measures.
- Are an effective tool for communicating with team members, executives, and stakeholders, since they make it easy to visualize progress and the completion of milestones and deliverables.
- Are a key tool in project planning, as they help managers determine the minimum time required to complete the project on schedule.
- Show the impact of real or potential scheduling and resource changes.
- Help you verify that your schedule is accurate and realistic.
- Allow you to ensure the right people are assigned to the right tasks and are available when needed.
Why Use a Google Sheets Gantt Chart Template?
There are a variety of project management software platforms that can be used to create Gantt charts. However, Google Sheets is a free, easy-to-use alternative to more costly, specialized software. Project management software can be complex, but most people are familiar with spreadsheet platforms, which makes Google Sheets a strong, free option for collaborating with executives and stakeholders.
As a cloud-based program, Google Sheets is accessible from anywhere and only requires a Google account to sign in. This makes it easy to collaborate with remote team members (or stakeholders outside the organization) who also have a Google account. You can choose whether to give collaborators editing privileges or view-only access. Additionally, unlike some software programs, multiple people can edit the document simultaneously, with all changes saved in the cloud.
By using a Google spreadsheet Gantt chart template, you can quickly create charts for tracking personal projects, or for presenting a status overview at meetings with executives and stakeholders. While starting each chart from scratch is a laborious process, templates allow you to get started quickly: simply enter your project information, and instantly produce a visually appealing, informative Gantt chart. This saves valuable time, which can be spent doing the actual work of the project.
Templates are especially important when using Google Sheets to make Gantt charts because there is no built-in functionality for creating them. The widgets that were available for this purpose were discontinued in 2013 — making templates the only way to avoid building the entire chart each time.
Project Management Gantt Charts
As mentioned, Gantt charts are a staple in the project management industry. They are typically created using the information from either a project plan or a work breakdown structure (WBS), which are generated during the early stages of the project lifecycle.
A project plan establishes a schedule, identifies dependent tasks, and lists tasks in the order that they need to be completed. The WBS outlines a hierarchy of phases, tasks, and subtasks. The start date noted in the project plan or WBS should correspond with the first task in your Gantt chart, while the end date should align with the completion of the last task. The Gantt chart may reflect the WBS by listing phases, tasks, and subtasks in the corresponding hierarchy, or there may simply be a column where you can list the WBS number corresponding to each task.
Before creating a Gantt chart, make sure you’ve also defined the project calendar. In addition to project kickoff and completion dates, include working days of the week and working hours per day. It’s also helpful to identify the team members who will be working on the project and the tasks they’ll be responsible for, so you can include this information on your chart.
Gantt and Burndown Charts in Scrum Project Management
Software development commonly uses Scrum project management to track an entire development project, the release of the latest version of a software product, or the rollout of a new feature. Scrum is a management approach that is part of the Agile project management methodology. In Agile, project work is divided into incremental phases, known as “sprints” within the Scrum framework.
A sprint is a period of time (hours, days, weeks, or months) in which team members need to complete certain segments of the final product, such as a set of features or a list of tasks. To learn more about Scrum, read Scrum Methodology for Efficient Project Management.
In software development and other complex projects, burndown charts are often included along with Gantt charts. These charts allow for even more granular tracking of project schedules. While a Gantt chart measures the entire project or release schedule, a burndown chart tracks the progress of an individual sprint. It aggregates the amount of work completed by each team member each day, and then reflects the total amount of work remaining for the team in that sprint. As long as the burndown chart is generally trending downwards, the sprint is on track.
Daily 15-minute meetings are a hallmark of Scrum project management. Gantt and burndown charts are frequently used in these meetings to give team members a quick snapshot of their progress, visualizing both the sprint and the project or release as a whole.
How to Add Content to a Google Gantt Chart Template
Once you’ve determined your project plan, WBS, or work schedule, enter the data into Google Sheets. Make sure to include the following information:
- Project start and end dates
- Phases or sprints, tasks, and subtasks
- Task duration (the amount of time each task will take to complete)
- Dependent tasks
- Overlapping/parallel tasks (those that can be worked on simultaneously)
- The percentage of work completed on each task (updated as progress is made)
- Team member assignments
Once you have entered all this information into your template, it will display the duration of each task as a horizontal bar. Each task will be listed vertically on the left-hand side - this way, you can clearly see end dates for both the project and individual tasks, which tasks have the greatest potential to impact project completion, how much work is remaining on in-progress tasks, and any past-due work.
Be sure to review and monitor your Gantt chart regularly to ensure everything is accurate and the project is progressing on schedule. If necessary, adjust your project plan and Gantt chart to reflect changes in scope or schedule. However, it’s important to remember that a Gantt chart is only a useful tool if it shows all the tasks required to finish the project, sprint, or release on time.
To help you plan and manage your projects more successfully, we created this collection of Google Sheets Gantt chart templates. Whether you’re planning a basic project, managing a complex project, tracking multiple projects at once, or need a template for Scrum project management, we’ve got the Google Sheets Gantt template that meets your needs.
Quickly Create a Gantt Chart in Smartsheet
From simple task management and project planning to complex resource and portfolio management, Smartsheet helps you improve collaboration and increase work velocity -- empowering you to get more done.
The Smartsheet platform makes it easy to plan, capture, manage, and report on work from anywhere, helping your team be more effective and get more done. Report on key metrics and get real-time visibility into work as it happens with roll-up reports, dashboards, and automated workflows built to keep your team connected and informed.
When teams have clarity into the work getting done, there’s no telling how much more they can accomplish in the same amount of time. Try Smartsheet for free, today.

